
A quarter when geopolitics moved back to centre stage
The first quarter of 2026 will be remembered for the return of geopolitical shock as the dominant market driver. The global economy entered the year on reasonably firm footing, but not on especially sturdy foundations. Inflation had been easing only slowly in several major economies, central banks were still wary of declaring victory, and growth had already become more uneven across regions. Through March, the Gulf crisis had shifted the entire tone of markets. Energy prices rose sharply, inflation concerns were revived, and asset markets began to price not only slower growth but also the risk that higher prices and weaker confidence might arrive together. The OECD’s March interim outlook captured the mood well: global resilience had not disappeared, but it was being tested by a fresh energy shock, with G20 inflation now projected to rise to 4.0% in 2026 rather than continue a smooth descent.
The chronology of the Gulf crisis mattered greatly for markets. What began as another flare-up in an already fragile region evolved into a fifth week of open conflict by quarter-end, bringing attacks across Iran and the Gulf, damage to shipping, and severe disruption to confidence around the Strait of Hormuz. By the final days of March, the conflict had become the key lens through which investors viewed inflation, growth and policy. The market reaction to every headline showed how quickly this had become the quarter’s central macro variable. On 31 March, President Trump said the United States believed it could wrap up its campaign within two to three weeks, a comment that immediately fed hopes of de-escalation even though the military and economic damage had already been considerable and at least for the moment US troops are not being stood down.
Economic data through the quarter reinforced the sense of a more difficult environment. In the United States, labour market indicators softened and hiring weakened, even as inflation concerns picked up again. The Federal Reserve stayed cautious, with policymakers signalling that the combination of sticky inflation and rising energy prices did not yet justify a return to easier monetary policy. In Europe, the energy shock pushed inflation back above target and revived concern that the region might once again face a stagflation-like mix of weak growth and higher costs. China, by contrast, showed some improvement in factory activity by quarter-end, though its recovery remained fragile and dependent on policy support.
Economic data had shown a trend of better than expected growth and lower than expected inflation (Chart 1) but that must inevitably change.
Chart 1: Global Economic Surprise Indices – The Calm Before the Storm
Index
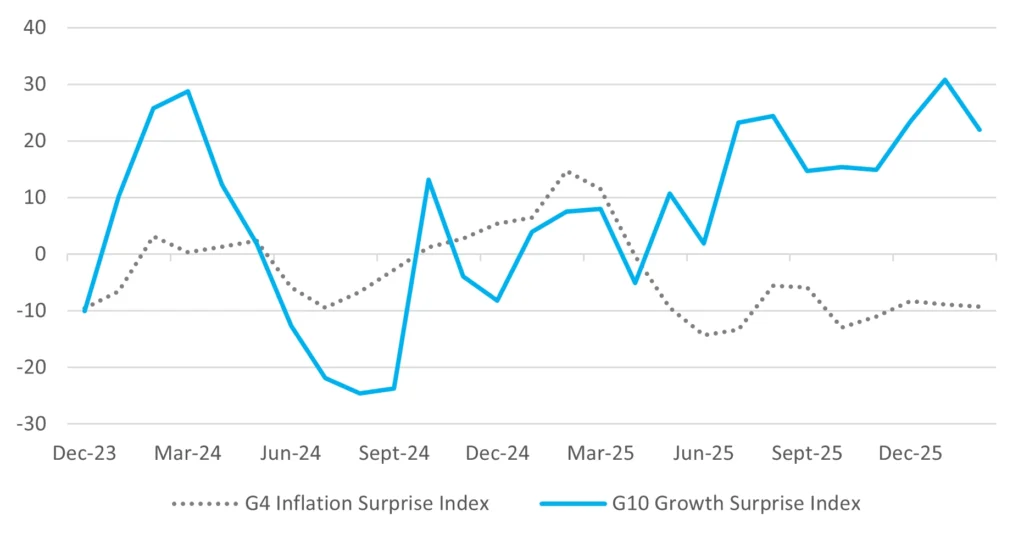
Source: Bloomberg
Against that background, first-quarter asset returns tell a coherent story. Equities struggled, particularly late in the quarter. Energy outperformed dramatically. Bonds provided only partial ballast. The US dollar regained some defensive appeal. Gold remained one of the best-performing assets over 12 months despite a volatile quarter-end correction. Crypto continued to behave like a high-beta risk trade rather than a safe haven although as the quarter ended there was a modest revival. What follows is less a tale of neat market rotations than one of capital retreating from complacency.
Markets
Chart 2: Asset Class Performances
rebased to Jan ’22 =100
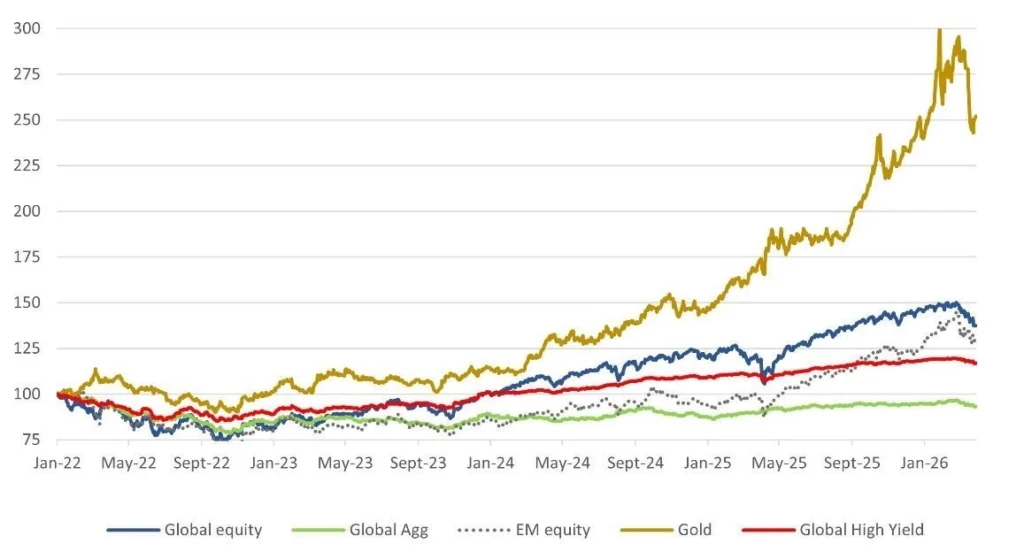
Source: Bloomberg
Global Equities
The quarter was difficult for global equities, though performance varied sharply by region. Developed markets fell 3.6% over the three months, while emerging markets were broadly flat at -0.2%. That relative resilience from emerging markets is more interesting than it first appears, because the final month of the quarter was notably weak almost everywhere. A fair reading is that emerging markets had built up enough relative momentum earlier in the period to absorb some of the late shock, whereas developed markets entered the crisis with richer valuations and less margin for disappointment.
The United States declined 4.6% over the quarter, with the NASDAQ falling 7.1%. That underperformance in growth-heavy US equities reflected several pressures at once. Higher long-end yields, concern about whether the artificial intelligence investment story had run ahead of itself, and then the late-quarter energy shock all weighed on sentiment. The US market still shows a respectable 12-month gain, but the quarter was a useful reminder that expensive leadership is most vulnerable when macro conditions turn less forgiving.
Chart 3: MSCI US relative to MSCI World ex US
rebased to 2012=100
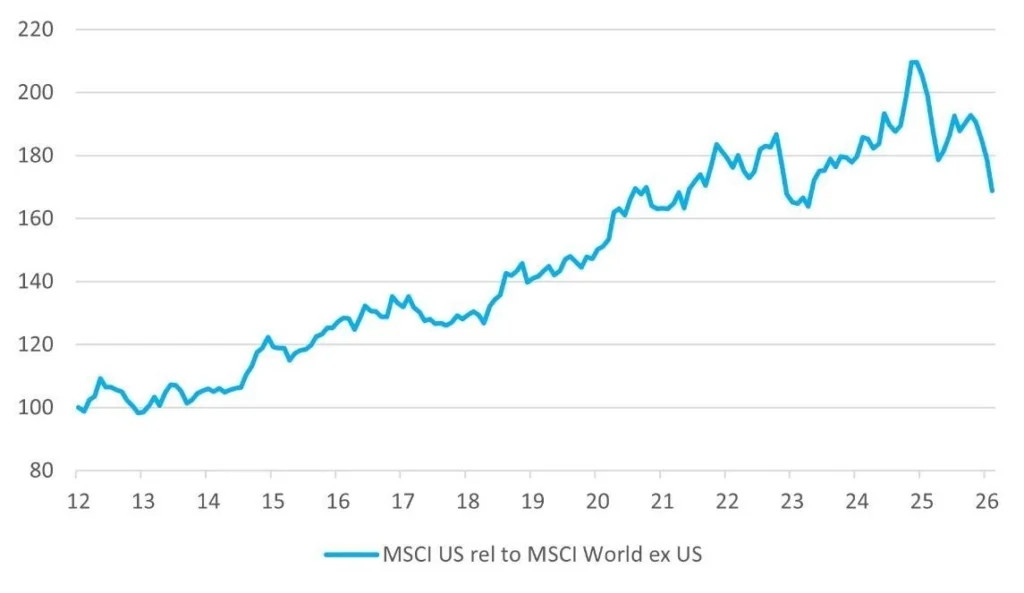
Source: Bloomberg
Europe fell 4.2% over the quarter, though the one-month decline of 10.6% shows just how much of the damage came late. European equities remain highly exposed to imported energy stress, and that sensitivity returned quickly. A region that had been slowly regaining confidence found itself once again confronting higher fuel costs, weaker external demand and renewed inflation pressure. The euro area inflation jump to 2.5% in March sharpened concern that monetary policy might not be able to turn supportive as soon as hoped.
Japan was one of the more resilient major markets over the quarter, rising 1.4% in dollar terms, and it remains one of the stronger 12-month performers in the table. That reflects the continued appeal of Japanese corporate reform, improved capital discipline and still-favourable earnings support. The UK also held up relatively well, rising 4.0% over the quarter, perhaps helped by a market structure with greater exposure to energy and financials and less dependence on expensive technology. Switzerland was weaker, down 3.7%, with its more defensive profile offering only partial protection in a period when rising energy costs and policy uncertainty upset traditional factor leadership.
Asia ex Japan slipped only 1.2% over the quarter, though again the final month was much worse than the quarter as a whole. China fell 8.9% over the three months, reflecting continued scepticism about the durability of its recovery even as March PMI data improved. Policy remains supportive, but confidence is still not fully repaired. India stood out as the clear laggard, down 18.1% over the quarter and down over 13% over 12 months. That is a material de-rating of what had been one of the market’s favoured structural stories. Some of that reflects valuation excess, some the sensitivity to higher energy prices, and some simply the reality that strong narratives still have to be validated by earnings.
Brazil, by contrast, remained a major outperformer, rising 19.1% over the quarter and 56.4% over 12 months. That strength suggests investors continue to reward markets where valuations, domestic policy and commodity linkages offer a more attractive balance than in heavily owned developed markets. More broadly, the regional pattern in the quarter shows that the world did not move in a single line. Instead, markets with commodity exposure, lower valuations or reform credibility generally fared better than those dependent on flawless growth assumptions.
Table 1: Equity Market returns in Q1 ’26
| -1MTH | -3MTH | -12MTH | |
| US | -4.9% | -4.6% | 17.3% |
| NASDAQ | -4.8% | -7.1% | 24.8% |
| Europe | -10.6% | -4.2% | 17.3% |
| Japan | -12.4% | 1.4% | 25.9% |
| UK | -5.9% | 4.0% | 23.0% |
| Switzerland | -8.8% | -3.7% | 1.4% |
| Asia ex Japan | -13.7% | -1.2% | 28.4% |
| India | -14.9% | -18.1% | -13.4% |
| China | -7.7% | -8.9% | 3.8% |
| Brazil | -1.9% | 19.1% | 56.4% |
| Emerging Markets | -13.1% | -0.2% | 30.4% |
| Dev Markets | -6.4% | -3.6% | 13.6% |
Source: Bloomberg
Equity sector performance
Sector performance captured the quarter’s macro message with unusual clarity. Energy rose 36.9% over the quarter, making it the unequivocal winner. In effect, energy became the market’s real-time indicator of geopolitical stress. As concerns over shipping, Gulf infrastructure and Hormuz disruption intensified, capital moved rapidly into the sector. Reuters noted that the quarter ended with Brent posting its biggest gain since the Gulf War period, a reminder that when the Middle East reasserts itself as a supply risk, old economy sectors recover their strategic importance very quickly.
By contrast, IT fell 9.0% over the quarter. That is a sizable correction in what had been one of the market’s strongest and most crowded themes. It would be too simple to call this the end of the technology leadership story, but the quarter did expose the vulnerability of long-duration equities when bond yields rise and the macro environment becomes more inflationary. Consumer Discretionary also struggled, down 10.8%, which fits with a world in which fuel costs rise, real incomes are squeezed and confidence softens.
Consumer Staples gained 4.0%, a modest but telling outcome. In a quarter dominated by uncertainty, investors were prepared to pay for resilience, though not at any price. Healthcare fell 4.6%, suggesting its usual defensive status was not enough to escape the broader de-risking. Banks also declined 4.6% over the quarter, even though their 12-month performance remains strong at 30.7%. That pattern suggests the sector had already enjoyed a substantial rerating but became more vulnerable as markets began to fear slower growth and a more complicated policy backdrop.
Taken together, sector returns tell a simple story. The quarter rewarded scarcity, hard assets and immediate cash-flow sensitivity to higher commodity prices. It punished duration, discretionary demand and any area of the market where valuations depended on calm macro conditions continuing indefinitely.
Table 2: Global equity sector returns Q1 ’26
| -1MTH | -3MTH | -12MTH | |
| Energy | 11.5% | 36.9% | 47.4% |
| IT | -4.6% | -9.0% | 16.2% |
| Consumer Staples | -8.9% | 4.0% | 5.8% |
| Consumer Discretion | -7.9% | -10.8% | -1.0% |
| Healthcare | -8.3% | -4.6% | 1.8% |
| Banks | -7.7% | -4.6% | 30.7% |
Source: Bloomberg
Bond markets
Fixed income did its job, but only partially. The Global Aggregate bond Index fell 0.2% over the quarter, US investment grade slipped 0.4%, emerging market debt lost 1.3% and high yield declined 0.5%. Those are much smaller losses than in equities, but they still fall short of the classic defensive performance many investors would hope for in a risk-off quarter.
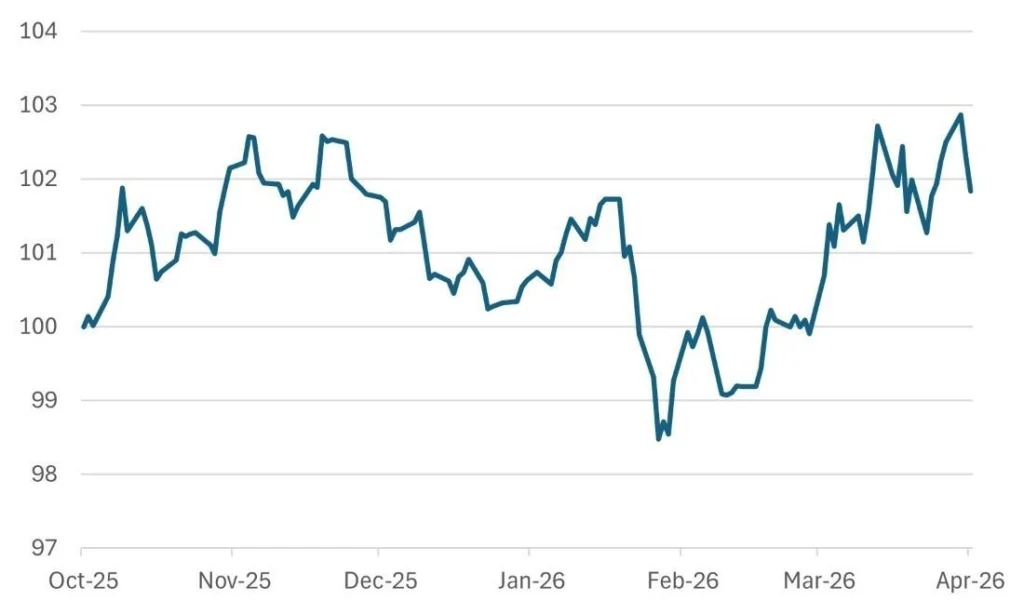
Chart 4: Global Aggregate Index sells off from February peak
Global Agg Index rebased to -1Y=100
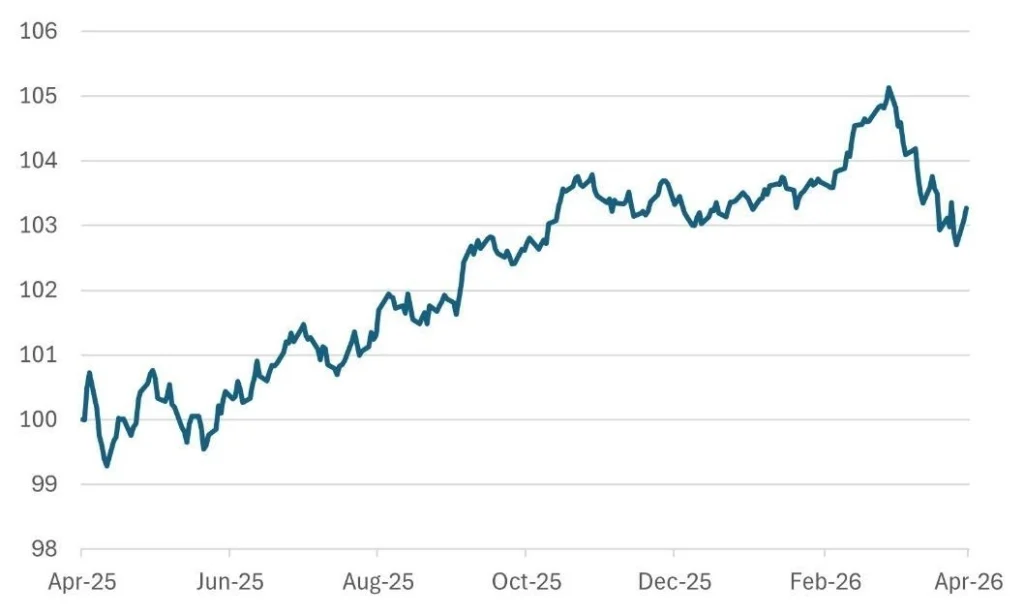
Source: Bloomberg
That pattern makes sense in context. The shock hitting markets was not simply one of weaker growth. It was also inflationary. Rising oil prices, the risk of prolonged supply disruption and renewed concern about central bank caution all limited the extent to which government bond yields could rally. Fed officials spent much of late March warning against complacency on inflation expectations, and the market response increasingly reflected that concern.
Investment grade credit held up reasonably well, which suggests investors did not see the quarter as the start of a full credit event. High yield was also relatively resilient on a quarterly basis, perhaps because spreads had not yet moved to levels implying deep recession. Emerging market debt, however, was weaker, not surprising in a quarter where a stronger dollar, higher oil and geopolitical anxiety would have made financing conditions less friendly for many borrowers.
For wealth management portfolios, the quarter reinforced an important point. Bonds still help, but in an inflation-sensitive geopolitical shock they cushion rather than rescue. That distinction matters. A diversified portfolio worked better than an equity-only allocation, but it did not enjoy the kind of clean negative correlation that investors once took for granted.
Chart 5: US 2-year Bond Yield down Sharply as Market Anticipates Fed Rate Cuts
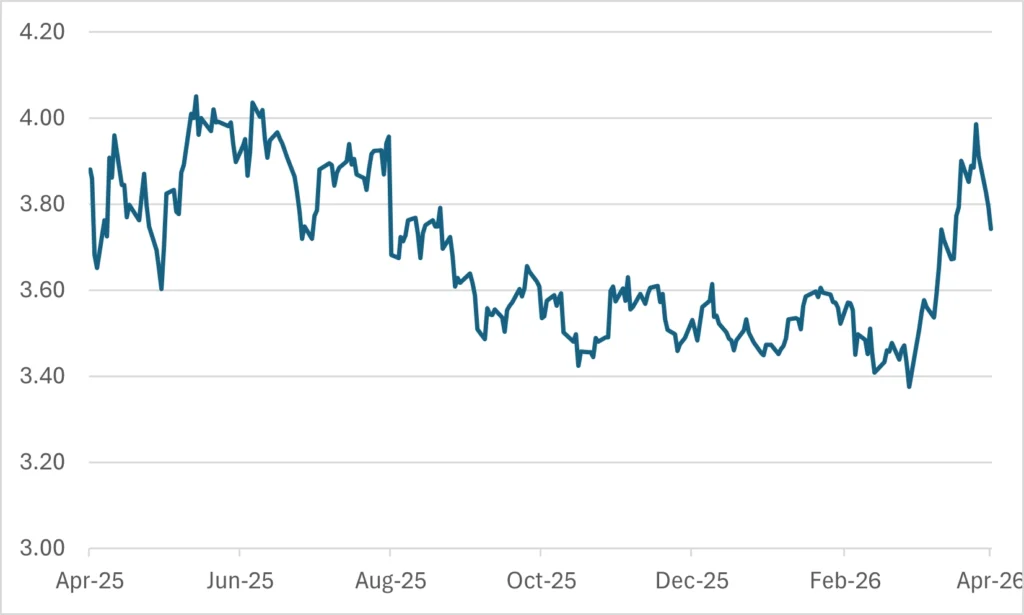
Source: Bloomberg
Table 3: Bond market returns In Q1 ’26
| -1mth | -3mths | -12mths | |
| Global Aggregate | 1.9% | 3.7% | 2.1% |
| Global investment Grade | 2.2% | 4.6% | 2.3% |
| Emerging markets debt $ | 1.8% | 4.3% | 4.1% |
| US Corporate High yield | 1.9% | 4.0% | 4.6% |
Source: Bloomberg
FX
The foreign exchange story in the quarter was dominated by a firmer US dollar. The USD Spot Index rose 1.7% over three months and 2.4% over one month, though it remains down over 12 months. That suggests the dollar regained short-term defensive appeal as the quarter deteriorated, even if the broader structural debate around the currency remains open.
Chart 6: Dollar Spot Index (DXY)
Source: Bloomberg
A stronger dollar during a geopolitical shock is hardly revolutionary. It reflects liquidity preference, reserve-currency status and, in uncertain times, the simple fact that many investors still run first toward dollars before they ask more philosophical questions later. Yet the quarter also showed why the medium-term debate about the dollar’s supremacy has not gone away. If energy shocks become more frequent, if allies are drawn into a more fragmented security environment, and if reserve managers continue to diversify incrementally, the dollar may remain tactically strong without being structurally unchallenged.
For emerging market currencies, this was not an ideal backdrop. A stronger dollar, more expensive energy and weaker risk appetite usually create differentiation rather than a uniform collapse. Commodity-linked currencies can hold up better, while energy importers tend to suffer more. That distinction helps explain why equity performance within emerging markets was so varied. Brazil’s strength, for instance, was consistent with an environment in which commodity linkage and valuation support matter more than broad benchmark membership.
Precious metals
Gold remains one of the quarter’s most interesting assets. It fell 11.6% over one month, yet it still gained 8.1% over three months and an extraordinary 63.3% over 12 months. That combination tells us two things. First, gold had already delivered substantial protection before the late-quarter correction. Second, even in a period of acute geopolitical stress, gold does not move in a straight line. Profit-taking, liquidity needs and a stronger dollar can all produce setbacks even when the strategic case remains intact.
Silver rose 4.9% over the quarter but is far less impressive over 12 months, up only 5.9%. That fits its mixed character as both precious metal and industrial input. In a quarter where growth worries and geopolitical fear arrived together, silver lacked the clarity of gold’s role.
Crypto again failed to establish itself as a dependable hedge against macro instability. Bitcoin fell 22.2% over the quarter and remains down 19.0% over 12 months, despite a modest gain in the final month. That is not the pattern of a refuge asset. It is the pattern of a volatile risk asset reacting to liquidity conditions, sentiment and speculation. When investors truly wanted protection in the first quarter, the evidence in the data points far more clearly to gold than to digital assets.
Table 4: Performance of precious metals and currencies in Q1 ’26
| -1MTH | -3MTH | -12MTH | |
| Gold | -11.6% | 8.1% | 63.3% |
| Silver | -19.9% | 4.9% | 5.9% |
| Bitcoin | 2.2% | -22.2% | -19.0% |
| USD Spot Index | 2.4% | 1.7% | -7.1% |
Source: Bloomberg
Sources: Legacy Wealth Advisors, Global CIO, Bloomberg
This report is provided for informational purposes only

